The MemoryAnalyzer Plugin for Eclipse allows us to quickly analyze heap dumps from a virtual machine and search for memory leaks. In the following tutorial we’re going to create and run a small application that is going to cause an OutOfMemoryException during its runtime.
In addition, we’re forcing the virtual machine to save a heap dump and finally analyzing this data using Eclipse and the MemoryAnalyzer plugin.
Prerequisites
Install the Eclipse Plugin
The good thing is that you don’t need to add any update site in Eclipse .. just search for MemoryAnalyzer and install the plugin..

Creating a Crash
The following code should product an OutOfMemoryException soon (never use Integer.MAX_VALUE in a loop’s stop condition this way – you’ll never reach an end..). To speed this thing up we’re giving the virtual machine a heap size maximum of 10MB using the start parameter -Xmx10M
The following start parameter forces the virtual machine to create a heap dump in a file named /tmp/heap.bin when an OutOfMemoryError occurrs: -XX:+HeapDumpOnOutOfMemoryError -XX:HeapDumpPath=/tmp/heap.bin
package com.hascode.tutorial;

import java.util.ArrayList;
import java.util.List;

public class Main {
 public static void main(final String... args) {
 System.out.println("start");
 List<Integer> numbers = new ArrayList<Integer>();
 for (int i = 0; i <= Integer.MAX_VALUE; i++) { // going to fail
 numbers.add(i);
 }
 System.out.println("stop");
 }
}
Run the app and the following output should appear soon – the app is available from the tutorial sources for download as an executable jar (dummy/outofmemory.jar).
$ java -Xmx10M -XX:+HeapDumpOnOutOfMemoryError -XX:HeapDumpPath=/tmp/heap.bin -jar outofmemory.jar
start
java.lang.OutOfMemoryError: Java heap space
Dumping heap to /tmp/heap.bin ...
Heap dump file created [11766725 bytes in 0.353 secs]
Exception in thread "main" java.lang.OutOfMemoryError: Java heap space
 at java.util.Arrays.copyOf(Arrays.java:2760)
 at java.util.Arrays.copyOf(Arrays.java:2734)
 at java.util.ArrayList.ensureCapacity(ArrayList.java:167)
 at java.util.ArrayList.add(ArrayList.java:351)
 at com.hascode.tutorial.Main.main(Main.java:11)
Taking a Heap Dump from a running Application
Of course you’re able to analyze a running application and the following tools bundled with your JDK might help you there:
jps
jps allows you to list running java applications and shows you their process id
Name
jps - Java Virtual Machine Process Status Tool

SYNOPSIS
jps [ options ] [ hostid ]

PARAMETERS
options
Command-line options.

hostid
The  host  identifier  of the host for which the process report should be generated. The hostid may include optional components that indicate the communications protocol, port number,
and other implementation specific data.
[..]
jmap
jmap allows you to create a dump from a specific java process – as an example, the following code creates a heap dump in binary format in a file /tmp/heap.bin for the running java process with id 2381:
jmap -dump:format=b,file=/tmp/heap.bin 2381Name
jmap - Memory Map
SYNOPSIS
jmap [ option ] pid
jmap [ option ] executable core
jmap [ option ] [server-id@]remote-hostname-or-IP
PARAMETERS
option
Options are mutually exclusive. Option, if used, should follow immediately after the command name.
pid
process id for which the memory map is to be printed. The process must be a Java process. To get a list of Java processes running on a machine, jps(1) may be used.
executable
Java executable from which the core dump was produced.
core
core file for which the memory map is to be printed.
remote-hostname-or-IP
remote debug server's (see jsadebugd(1)) hostname or IP address.
server-id
optional unique id, if multiple debug servers are running on the same remote host.Analyzing Data
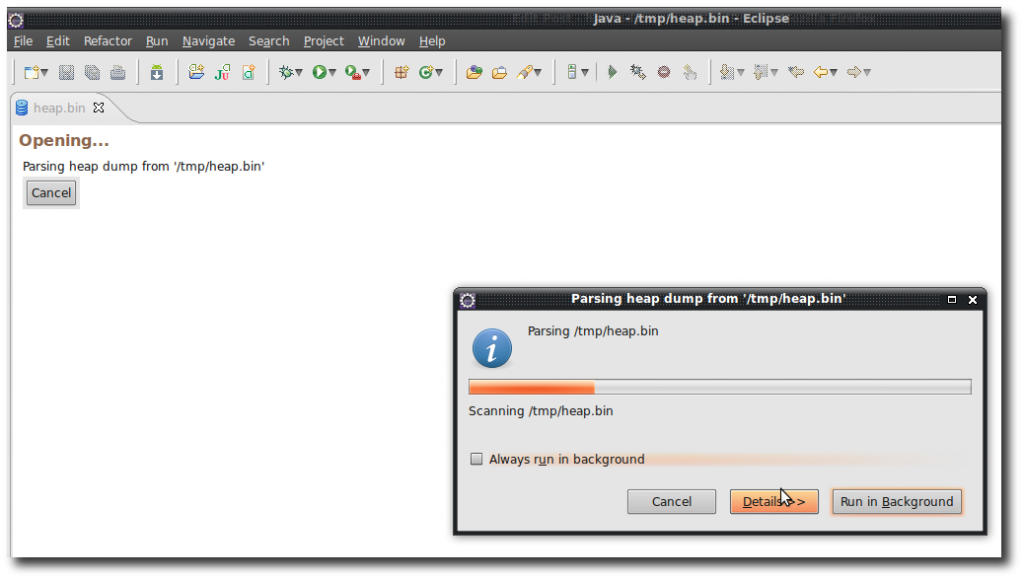
Now start your Eclipse and select File > Open .. and select the dump file .. e.g. /tmp/heap.bin from the example above .. the analyzer plugin will start to read the dump automatically..

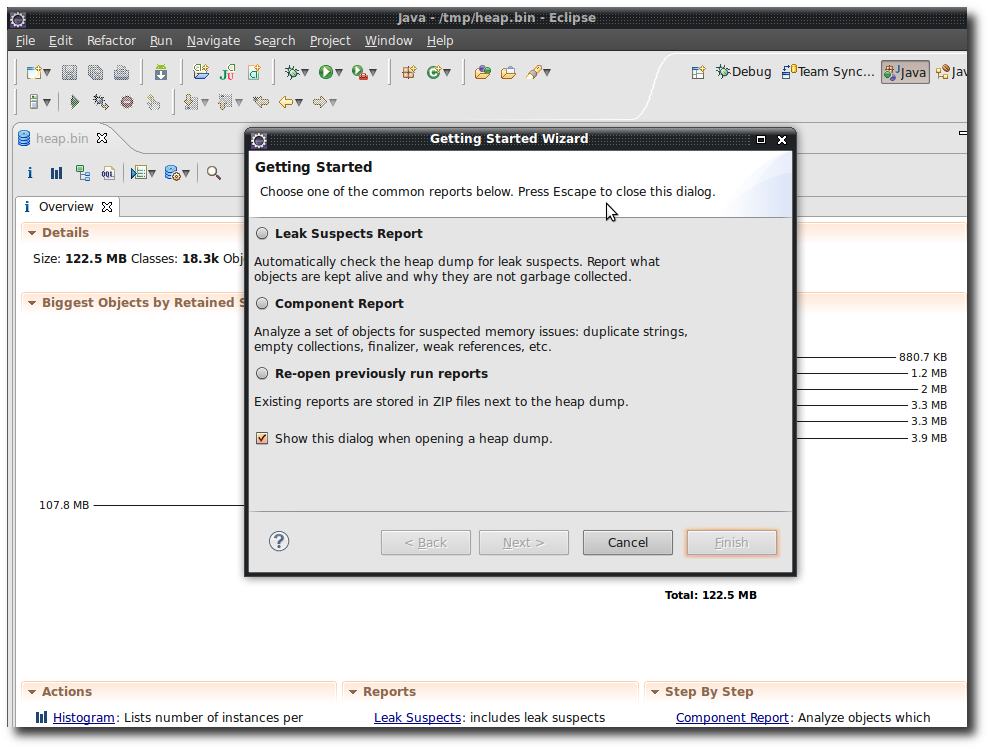
Having finished loading the dump a nice wizards helps you to create one of the several available reports ..

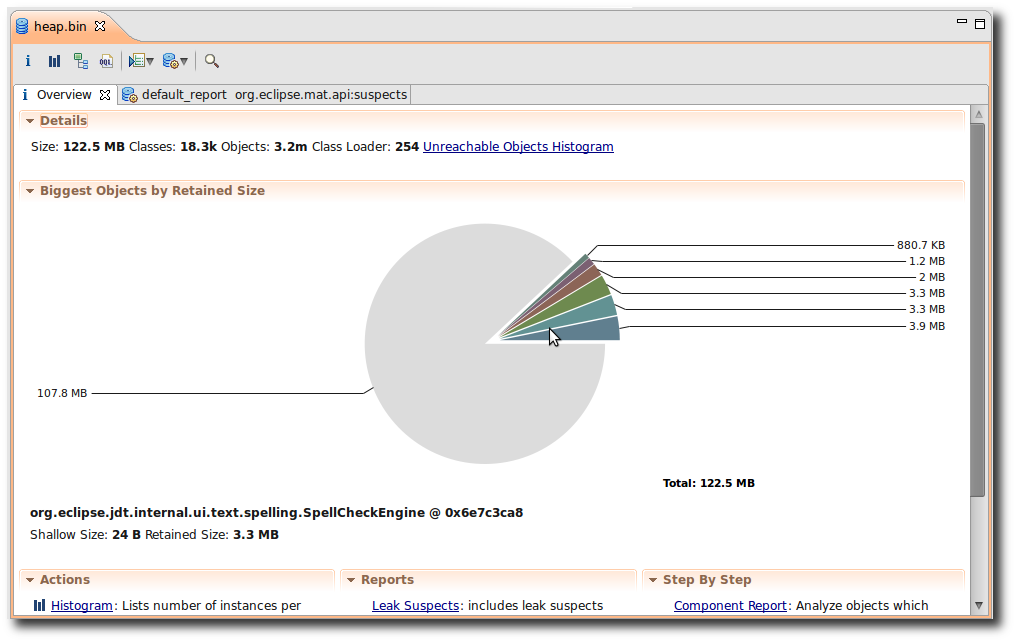
You’ve got several reports, statistics and interesting pieces of information there so have some fun playing around with the different features :)

Tutorial Sources
I have put the source from this tutorial on my GitHub repository – download it there or check it out using Git:
git clone https://github.com/hascode/memory-analyzer-tutorial.gitResources
Forensic Analysis
I have summarized different tools and workflows for analyzing Java applications and systems (including the Eclipse Memory Analyzer) here: http://app.hascode.com/forensic/
Article Updates
-
2018-05-13: Link to forensic analysis article added.