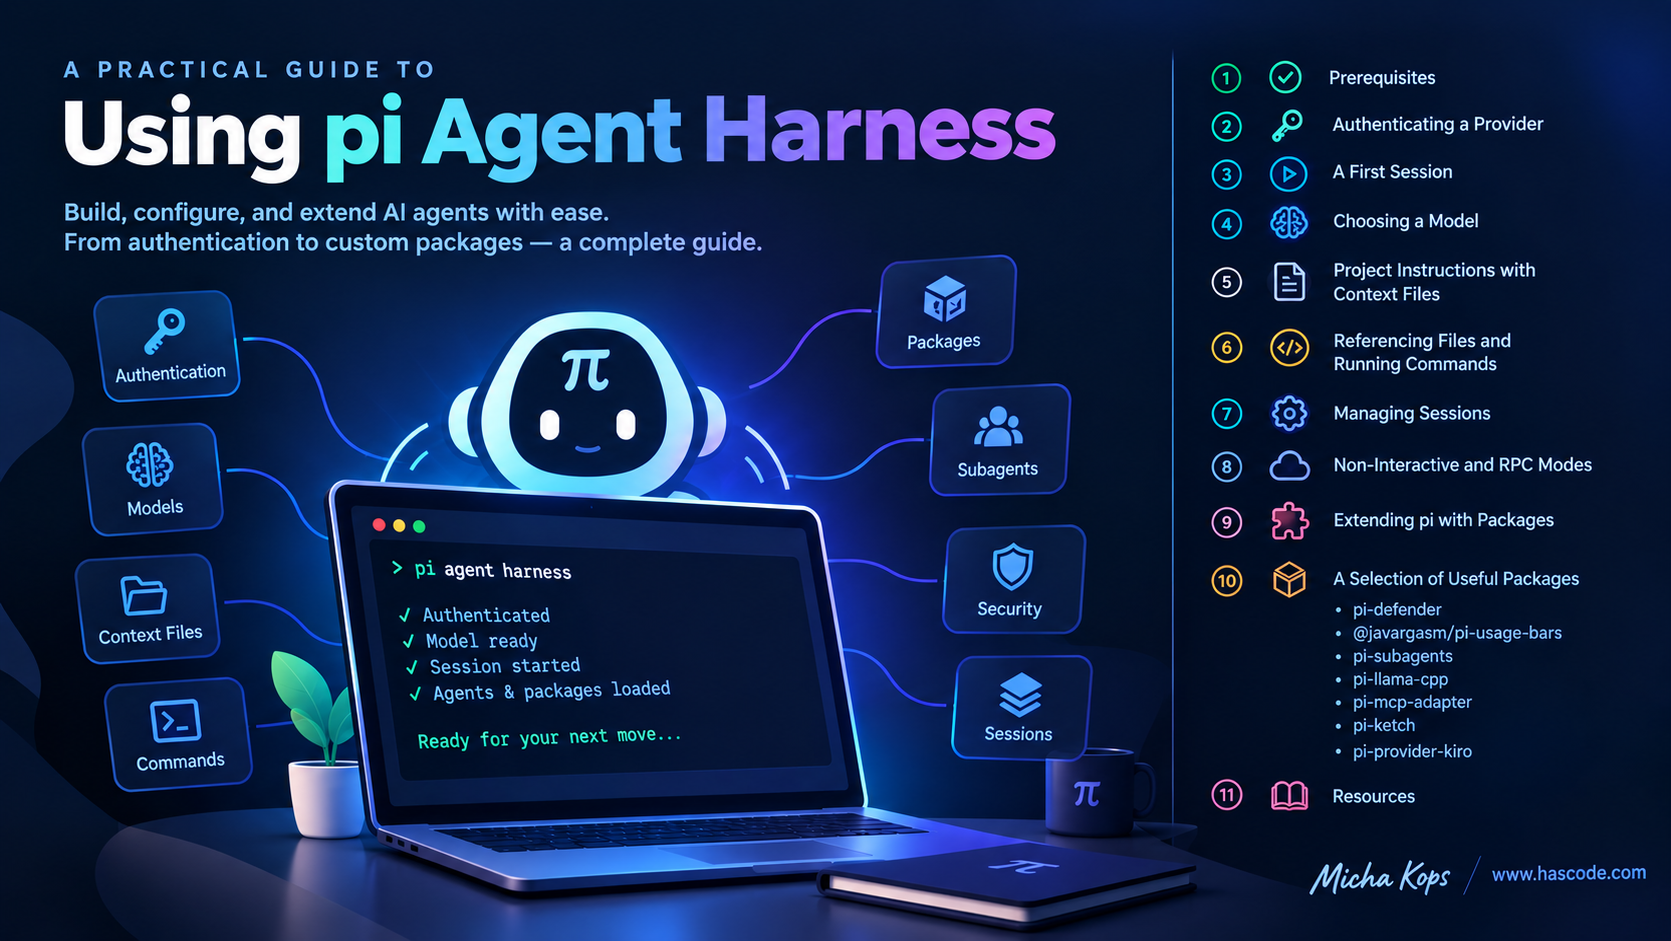

AI coding agents have moved from the browser into the terminal, right next to the tools we already use every day. pi is such an agent: a fast, terminal-native coding assistant that reads and writes files, runs shell commands and talks to a range of LLM providers – all from within your project directory.
What makes pi interesting is that it is scriptable and extensible. Besides its interactive TUI it offers a non-interactive mode for one-shot prompts and an RPC mode for embedding it into other tools, and it can be extended with custom tools, skills, prompt templates and themes packaged and shared through npm or git.
In the following tutorial I’m going to demonstrate how to install pi, authenticate a provider, run a first session, work with tools and context files, manage sessions and extend pi with packages.
Prerequisites
pi is distributed as an npm package and requires a recent Node.js. Install it globally:
npm install -g --ignore-scripts @earendil-works/pi-coding-agentThe --ignore-scripts flag disables dependency lifecycle scripts during install – pi does not need them for a normal install.
Verify the installation:
pi --versionOutput
Running the command above should produce a similar output:
0.84.4Authenticating a Provider
pi can use subscription providers through an interactive login, or API-key providers through environment variables. The quickest way with an API key is to export it before launching pi:
export ANTHROPIC_API_KEY=sk-ant-...
pi
Alternatively, start pi and run the /login command to pick a subscription provider such as Claude Pro/Max, ChatGPT Plus/Pro or GitHub Copilot. Credentials are stored in ~/.pi/agent/auth.json.
A First Session
Start pi from the project you want it to work on:
cd /path/to/project
pi
Once pi starts, type a request and press Enter:
Summarize this repository and tell me how to run its checks.By default pi gives the model four tools it can call while working:
-
read– read files -
write– create or overwrite files -
edit– patch files -
bash– run shell commands
Additional read-only tools (grep, find, ls) are available through tool options. pi runs in your current working directory and can modify files there, so use git or another checkpointing workflow if you want easy rollback.
Choosing a Model
pi supports many models across providers. List the available models:
pi --list-modelsOutput
Running the command above should produce a similar output:
provider  model              context  max-out  thinking  images
kiro      claude-opus-4-5    200K     64K      yes       yes
kiro      claude-sonnet-4-5  200K     64K      yes       yes
kiro      gpt-5-6-sol        272K     128K     yes       no
...
You can pick a model at startup or switch it during a session:
pi --provider anthropic --model claude-sonnet-4-5Inside a session, use /model (or Ctrl+L) to switch models and /thinking to choose a reasoning level for models that support it.
Project Instructions with Context Files
pi loads context files at startup so you can teach it how to work in a project. Add an AGENTS.md file to the project root:
# Project Instructions

- Run `npm run check` after code changes.
- Do not run production migrations locally.
- Keep responses concise.
pi loads ~/.pi/agent/AGENTS.md for global instructions and AGENTS.md or CLAUDE.md from the current and parent directories. After changing a context file, restart pi or run /reload.
Referencing Files and Running Commands
Inside the editor, type @ to fuzzy-search files, or pass them on the command line:
pi @README.md "Summarize this"
pi @src/app.ts @src/app.test.ts "Review these together"
You can also run shell commands directly from the interactive prompt. The output is sent to the model as context:
!npm run lintUse !!command to run a command without adding its output to the model context.
Managing Sessions
pi saves sessions automatically, so you can pick up where you left off:
pi -c                  # Continue the most recent session
pi -r                  # Browse and resume previous sessions
pi --name "my task"    # Set a session display name at startup
pi --session <path|id> # Open a specific session
Inside pi, the commands /resume, /new, /tree, /fork and /clone let you branch and navigate the session history.
Non-Interactive and RPC Modes
For scripting, pi runs one-shot prompts and exits with the -p flag:
pi -p "Summarize this codebase"
cat README.md | pi -p "Summarize this text"
pi -p @screenshot.png "What's in this image?"
For structured integration you can switch the output mode. --mode json emits agent events as JSON lines, while --mode rpc starts a JSON protocol over stdin/stdout for embedding pi into other tools and IDEs:
pi -p "list the top-level modules" --mode json
pi --mode rpc
Extending pi with Packages
pi packages bundle extensions, skills, prompt templates and themes and can be shared through npm or git. Install and manage them from the CLI:
pi install npm:@foo/bar@1.0.0
pi install git:github.com/user/repo@v1
pi list                     # show installed packages
pi remove npm:@foo/bar
pi update --extensions      # update packages
To try a package for a single run without installing it permanently, use -e:
pi -e npm:@foo/bar| pi packages run with full system access – extensions execute arbitrary code and skills can instruct the model to perform any action. Review the source of third-party packages before installing them. |
A Selection of Useful Packages
The ecosystem around pi is growing quickly. The following packages are ones I run myself and can recommend as a starting point. Each is installed with the familiar pi install command and takes effect after a restart.
pi-defender
pi-defender adds defense-in-depth protection by intercepting dangerous bash commands and file operations before they execute – think rm -rf, sudo, curl | bash, DROP TABLE or git push --force. It ships a strict mode where every command needs approval and a patterns-only mode that prompts just for risky commands.
pi install npm:pi-defenderThe protection level is chosen at session start or with the /defender:default-mode command:
/defender:default-mode              # open the interactive selector
/defender:default-mode strict       # every command requires approval
/defender:default-mode patterns     # prompt only for dangerous commands
/defender:default-mode off          # disable the defender
Add --local to persist the setting per project in .pi/defender.yaml.
@javargasm/pi-usage-bars
@javargasm/pi-usage-bars gives you visibility into your provider usage: color-coded footer status bars for the active model and a /usage command that lists all connected providers – handy for keeping an eye on subscription limits across Codex, Claude, Gemini, Kiro and others.
pi install npm:@javargasm/pi-usage-barsOnce installed and using a supported model, the usage bars show up automatically in the footer, and you can query all providers at once:
/usage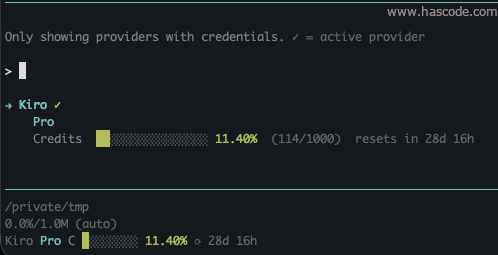
pi-subagents
pi-subagents lets pi delegate work to focused child agents. Instead of doing everything in a single session, the parent session can spawn subagents – separate, focused pi sessions each with their own job – for code review, codebase reconnaissance, implementation, parallel audits or a second opinion before a risky decision. Foreground runs stream into the conversation, while background runs keep working and can be checked later.
pi install npm:pi-subagentsInstalling the extension does not start a reviewer in the background – it gives the model a subagent tool. You do not need to write config or learn slash commands to get going; just ask in plain language and pi decides which agent to use and how to compose the work:
Use reviewer to review this diff.
Ask oracle for a second opinion on my current plan and challenge my assumptions.
Use scout to understand the auth flow before we start planning.
The extension ships with a handful of builtin agents that you can use immediately:
-
scout– fast local codebase recon: relevant files, entry points, data flow, risks -
researcher– web and docs research with sources and a concise brief -
worker– implementation work: edits files, validates and escalates instead of guessing -
reviewer– code review and small fixes against the task, tests and edge cases -
oracle– a second opinion that challenges assumptions without editing -
delegate– a lightweight general delegate close to the parent session
A useful rule of thumb is scout before you understand the code, researcher before you trust external facts, worker to implement, reviewer to check and oracle when the decision itself feels risky.
Subagents shine when run in parallel – for example fanning out several reviewers with distinct angles:
Run parallel reviewers: one for correctness, one for tests, and one for unnecessary complexity.For repeatable patterns the package bundles prompt shortcuts. /parallel-review launches fresh-context reviewers and synthesizes what to fix, /review-loop runs worker/reviewer/fix cycles until clean or capped and /council convenes a bounded set of model-based advisors to debate a material decision:
/parallel-review              # fresh reviewers with distinct angles, then a summary
/parallel-review autofix      # additionally apply the fixes worth doing now
/review-loop                  # parent-controlled review loop until clean or capped
/council "Should we migrate to a monorepo?" --max-passes 2
Running work stays visible: in the TUI a FleetView below the editor shows active children, and /subagents-fleet opens a live inspector where you can read transcripts, steer a running child or stop a run. If something feels off, /subagents-doctor verifies the setup.
Models are configurable per role. Builtin agents inherit your current pi default model, but you can pin a stronger model to a single role in ~/.pi/agent/settings.json – handy for letting oracle reason with a premium model while cheaper roles do the legwork:
{
  "subagents": {
    "defaultModel": "claude-sonnet-4-5",
    "agentOverrides": {
      "oracle": {
        "model": "claude-opus-4-5",
        "thinking": "high"
      }
    }
  }
}
For a single run you can override the model right in the command:
/run reviewer[model=anthropic/claude-sonnet-4:high] "Review this diff"
Each subagent is a full pi session with its own tool access. As with any package, review what child agents are allowed to do before turning them loose on a project – especially the worker, which edits files.
|
pi-llama-cpp
pi-llama-cpp connects pi to a running llama.cpp server so you can chat with local GGUF models right inside pi – no cloud account, no API keys, no data leaving your machine. The extension auto-detects every model available on the server, shows a live status indicator next to each one, and lets you load, switch and unload models through the /models command. Multiple llama.cpp servers can be connected simultaneously.
pi install npm:pi-llama-cppInstalling a llama.cpp server
Before the extension can do anything, llama-server must be running locally (or on a network-accessible machine). There are several ways to get it depending on your platform and whether you need GPU acceleration.
macOS
The simplest path on macOS is Homebrew. The formula bundles the Metal backend so inference runs on the GPU automatically, no extra flags needed:
brew install llama.cppLinux – CPU-only (pre-built binary)
For CPU-only inference, download the pre-built binary tarball from the llama.cpp releases page, extract it and optionally place it on your PATH:
# replace b10826 with the latest build tag from the releases page
RELEASE=b10826
wget "https://github.com/ggml-org/llama.cpp/releases/download/${RELEASE}/llama-${RELEASE}-bin-ubuntu-x64.tar.gz"
tar -xzf "llama-${RELEASE}-bin-ubuntu-x64.tar.gz"
sudo cp "llama-${RELEASE}/llama-server" /usr/local/bin/
An arm64 tarball (llama-${RELEASE}-bin-ubuntu-arm64.tar.gz) is available for Raspberry Pi and other ARM boards.
Linux – NVIDIA GPU (build from source)
The release page does not ship a pre-built CUDA binary for Linux. Build from source with cmake and the CUDA toolkit:
# prerequisites: git, cmake, a C++17 compiler, and the CUDA toolkit
# https://developer.nvidia.com/cuda-downloads
git clone https://github.com/ggml-org/llama.cpp
cd llama.cpp
cmake -B build -DGGML_CUDA=ON
cmake --build build --config Release -j $(nproc)
sudo cp build/bin/llama-server /usr/local/bin/
The build will detect your installed CUDA toolkit automatically. Pass -DCMAKE_CUDA_ARCHITECTURES=native to optimise for your specific GPU.
Linux and macOS – Python wheel (alternative)
llama-cpp-python ships Python bindings and an OpenAI-compatible server in one pip install. This is convenient if Python is already in your stack. The server is started with python3 -m llama_cpp.server and listens on port 8000 by default:
# CPU-only
pip install "llama-cpp-python[server]"

# NVIDIA GPU (cuBLAS) – compile-time flag via env variable
CMAKE_ARGS="-DGGML_CUDA=ON" pip install "llama-cpp-python[server]" --force-reinstall

# Start the server
python3 -m llama_cpp.server \
  --model ~/models/qwen2.5-0.5b-instruct-q4_k_m.gguf \
  --port 8080
When using llama-cpp-python, point the extension at the correct port. The Python server defaults to 8000; the examples in this article pass --port 8080 to keep the URL consistent with the native llama-server default.
|
Windows
Pre-built CPU and CUDA zip archives are available on the releases page (e.g. llama-bXXXXX-bin-win-cuda-12.4-x64.zip). Extract the zip, then run llama-server.exe from a command prompt. If you use the CUDA build, place the matching cudart DLLs (from the separate cudart-llama-bin-win-cuda-*.zip archive on the same release page) in the same directory.
Downloading a model
The extension works with any GGUF-quantized model. A good starting point is Qwen2.5-0.5B-Instruct Q4_K_M – a 463 MB file that loads entirely into GPU memory on modest hardware and runs at several hundred tokens per second on a modern desktop GPU:
mkdir -p ~/models
wget "https://huggingface.co/Qwen/Qwen2.5-0.5B-Instruct-GGUF/resolve/main/qwen2.5-0.5b-instruct-q4_k_m.gguf" \
     -O ~/models/qwen2.5-0.5b-instruct-q4_k_m.gguf
Starting the llama.cpp server
The extension talks to a standard llama.cpp server. Start it with --model for single-model mode (the simplest setup):
llama-server \
  --model ~/models/qwen2.5-0.5b-instruct-q4_k_m.gguf \
  --port 8080 \
  --ctx-size 4096 \
  -ngl 33         # offload all 33 layers to GPU; omit for CPU-only
Verify the server is up before starting pi:
curl http://127.0.0.1:8080/healthOutput
{"status":"ok"}Configuring the extension
By default pi-llama-cpp expects the server at http://127.0.0.1:8080, so no config is needed for a local single-server setup. If you want a named entry in the model picker, add the llamaSettings block to your global settings:
{
  "llamaSettings": {
    "servers": [
      {
        "url": "http://127.0.0.1:8080",
        "id": "local",
        "name": "Local Server"
      }
    ]
  }
}
With this config the server appears in the model picker as Llama.cpp (Local Server).
Alternatively, set the URL as an environment variable and skip the JSON entirely:
export LLAMA_SERVER_URL="http://127.0.0.1:8080"
pi
Working with models inside pi
Once pi starts with the extension active, run /models to open the live model browser:
/models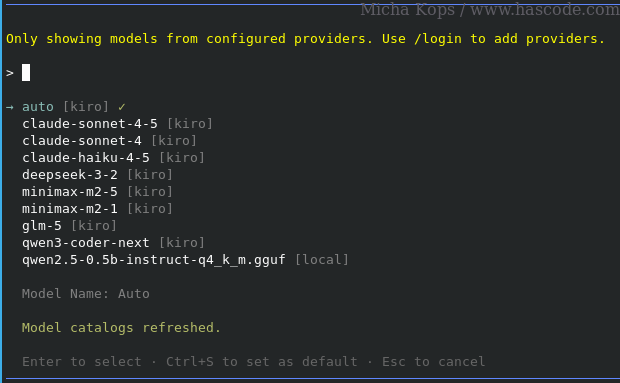
Select a model from the list to load it and switch the active session to it. The same /models command also lets you unload a model to free GPU memory or view detailed information (context size, capabilities) with /models info.
| Local models run entirely on your hardware. Performance and output quality vary widely depending on the quantization level and model size. The Q4_K_M Qwen2.5-0.5B used in this example is a demonstration model – for serious coding tasks use a larger quantization (Q8) or a bigger model such as Qwen2.5-7B or Qwen2.5-Coder-7B. |
pi-mcp-adapter
The Model Context Protocol (MCP) lets tools expose a structured catalogue of capabilities that any agent can call. The problem with connecting MCP servers directly is cost: a single server can add 10,000 tokens of tool definitions to every request, and connecting several servers burns a large slice of the context window before any real work starts.
pi-mcp-adapter solves this by replacing all connected MCP servers with a single proxy tool (~200 tokens) that the model uses to search, describe and call MCP tools on demand. Servers start lazily when first called and disconnect after ten minutes of idle time. Tool metadata is cached to disk, so search and list work instantly even before a server has connected.
pi install npm:pi-mcp-adapterConfiguring MCP servers
The adapter reads the standard .mcp.json config file from the project root, and a global ~/.config/mcp/mcp.json for servers shared across all projects. No pi-specific file is needed for a basic setup.
Each server entry follows the same shape as other MCP-aware tools: a command and args for stdio servers, or a url for HTTP servers. The filesystem server from the official MCP SDK is a good first example – it requires no authentication and gives the model scoped read/write access to a directory tree:
{
  "mcpServers": {
    "filesystem": {
      "command": "npx",
      "args": ["-y", "@modelcontextprotocol/server-filesystem", "/path/to/project"]
    }
  }
}
The precedence order when multiple config files are present is (later entries win):
-
~/.config/mcp/mcp.json– user-global shared config -
~/.agents/mcp.jsonand~/.agents/mcp/mcp.json– tool-agnostic global config -
~/.pi/agent/mcp.json– pi global override -
.mcp.json– project-local shared config -
.pi/mcp.json– pi project override
Using MCP tools inside pi
Once a server is configured and pi is restarted (or /reload is run), the adapter registers a single mcp proxy tool. The model uses this to look up and call server tools without any of them occupying context upfront:
mcp({ search: "list" })Output
list_directory
  Get a detailed listing of all files and directories in a specified path.
list_allowed_directories
  Returns the list of directories that this server is allowed to access.
Once the right tool is identified, call it directly:
mcp({ tool: "list_directory", args: { path: "/path/to/project" } })You can also ask in plain language and pi will search and call the appropriate tool on its own – you do not need to remember tool names.
The /mcp command opens an interactive panel showing connection status, available servers and their tool counts. Servers that need OAuth authentication display a prompt there or respond to /mcp-auth <server>.
Promoting tools to first-class pi tools
For tools you use frequently, directTools registers them individually in pi’s tool list instead of routing them through the proxy. The model then sees them as native tools without having to search first:
{
  "mcpServers": {
    "filesystem": {
      "command": "npx",
      "args": ["-y", "@modelcontextprotocol/server-filesystem", "/path/to/project"],
      "directTools": ["read_text_file", "list_directory"]
    }
  }
}
With directTools: true every tool from the server is promoted; with an array, only the named tools are. The rest remain behind the proxy.
Each additional directTools entry consumes context tokens directly. Promote only the tools the model needs to call frequently; leave discovery-oriented or rarely-used tools behind the proxy.
|
Slash commands
| Command | What it does |
|---|---|
|
Interactive panel: server status, tool counts, auth prompts |
|
Guided first-run: import host configs, scaffold |
|
List all tools from all connected servers |
|
Connect or reconnect a specific server |
|
Disable a server in |
|
OAuth setup for a server that requires authentication |
Example: querying a PostgreSQL database running in Docker
This example shows both MCP servers working in combination: @hypnosis/docker-mcp-server to inspect and control the Docker stack, and @modelcontextprotocol/server-postgres to run SQL queries against the database. Both are configured in .mcp.json and reach the same Postgres container – the Docker MCP server through the Docker socket, and the Postgres MCP server through the published port.
First, add a compose.yaml in the project root and start the database:
services:
  postgres:
    image: postgres:16
    environment:
      POSTGRES_USER: demo
      POSTGRES_PASSWORD: demo
      POSTGRES_DB: demo
    ports:
      - "5433:5432"
    healthcheck:
      test: ["CMD-SHELL", "pg_isready -U demo"]
      interval: 5s
      timeout: 3s
retries: 5docker compose up -d
docker compose ps # wait until Status shows (healthy)Then add both MCP servers to .mcp.json. The Docker MCP server needs cwd set to the project directory so it can locate the compose file, and the Postgres MCP server receives the connection string as a CLI argument:
{
  "mcpServers": {
    "docker": {
      "command": "npx",
      "args": ["-y", "@hypnosis/docker-mcp-server"],
      "cwd": "/path/to/project"
    },
    "postgres": {
      "command": "npx",
      "args": [
        "-y",
        "@modelcontextprotocol/server-postgres",
        "postgresql://demo:demo@localhost:5433/demo"
      ]
    }
  }
}
Replace /path/to/project with the absolute path to the directory that contains compose.yaml. The Docker MCP server uses this path to parse the compose file and map service names to container images and database engines.
|
With the servers configured, restart pi (or /reload) and the mcp proxy tool becomes the single entry point for both. Check the stack health first, then run a query:
mcp({ tool: "docker_container", args: { action: "list", project: "myproject" } })Output
myproject · 1 containers

postgres  running healthy  postgres:16  5433:5432
Now query the database through the Postgres MCP server:
mcp({ tool: "query", args: { sql: "SELECT category, COUNT(*) AS items, ROUND(AVG(price)::numeric, 2) AS avg_price FROM products GROUP BY category ORDER BY avg_price DESC" } })Output
[
  { "category": "furniture",   "items": "1", "avg_price": "449.99" },
  { "category": "displays",    "items": "1", "avg_price": "299.99" },
  { "category": "video",       "items": "1", "avg_price": "79.99"  },
  { "category": "peripherals", "items": "3", "avg_price": "58.32"  }
]
You can also ask the Docker MCP server to query the database directly through the container, without a published port, using docker_db. This requires passing the compose file path so the server can identify the database engine:
mcp({ tool: "docker_db", args: {
  action: "query",
  service: "postgres",
  project: "myproject",
  compose_path: "/path/to/project/compose.yaml",
  query: "SELECT version, size, connections, uptime FROM pg_stat_database WHERE datname = current_database()"
}})
docker_db shells into the container and runs the query through the database’s own CLI (psql, mysql, etc.), so no port needs to be published and no credentials need to leave the container. The action: "status" variant asks the database about itself – version, size, active connections, uptime – without writing any SQL.
pi-ketch
The web is full of information the model does not have: release notes published yesterday, real-world usage examples in public repositories, rendered JavaScript pages, library documentation. pi-ketch brings all of that into pi as a set of native tools – web search, public code search, library documentation, page extraction and bounded site crawling – by wrapping the Ketch CLI directly. There is no MCP daemon to manage and no long-lived process to babysit; each call spawns a short-lived ketch process, collects its JSON output and returns bounded Markdown.
pi install npm:pi-ketchRestart pi or open a new session. The tools and a bundled research skill load automatically.
Installing Ketch
Before the extension can do anything, ketch 0.11 or newer must be available on your PATH. On macOS the Homebrew tap is the simplest path:
brew install 1broseidon/tap/ketchFor other platforms, download a release binary from the Ketch releases page and place it on your PATH. If the binary has a different name or location, set KETCH_BIN to its absolute path.
Configuring a search backend
Web search needs one configured default backend. Brave is Ketch’s default and is recommended because it requires only an API key and no local setup:
ketch config set brave_api_key <key>If you prefer not to create a Brave account, DuckDuckGo works without credentials:
ketch config set backend ddgOther providers – Exa, SearXNG, Firecrawl, Keenable – are available; consult the Ketch configuration reference for the keys each one needs. Run ketch doctor to verify what is usable before opening pi:
ketch config
ketch doctor
ketch search "test query"
Optional: browser rendering
Ketch can use a local headless Chromium browser for JavaScript-rendered pages. Static pages do not need it, so this step is optional. Install Chromium once and then point Ketch to it:
ketch browser installThe installer prints the exact ketch config set browser … command for the binary it placed. Copy and run it, then verify:
ketch browser status
ketch doctor
Once configured, Ketch selects the browser automatically for JavaScript-heavy pages. You can also force it per call by passing forceBrowser: true to ketch_scrape when the ordinary fetch returns an empty or incomplete shell.
What it adds
| Tool | Use it for |
|---|---|
|
Current web results, news, comparisons, and opinions |
|
Clean Markdown or raw HTML from a known URL |
|
Bounded, same-host site crawling with partial results |
|
Real-world usage examples in public OSS repositories |
|
Resolving libraries and querying Context7 documentation |
ketch_code reaches grep.app and Sourcegraph by default; GitHub Code Search activates automatically when gh auth login or a GITHUB_TOKEN is present. ketch_docs requires a Context7 API key set with ketch config set context7_api_key <key>.
Example usage
Once the extension is active you can ask in plain language and pi picks the right tool:
Find current reporting on Go 1.26 and cite primary sources.Find public repositories using http.NewRequestWithContext and link to each example.Resolve React in Context7, then find its guidance on useEffect cleanup.Read https://example.com and summarize it.You can also name a tool explicitly and pass constraints such as limit, maxChars or maxPages to control how much content comes back.
Slash commands
| Command | What it does |
|---|---|
|
Print the active Ketch binary version |
|
Show the current Ketch configuration |
|
Probe all configured surfaces and report what is usable |
Configuration changes – setting API keys, switching backends, installing the browser – are intentionally not exposed as agent tools. Use ketch config set directly in a terminal for those.
| Fetched pages are untrusted source material. pi-ketch applies size bounds before returning content to the model (6,000 characters per page by default, 50 KB hard cap), but always treat external content as data, not instructions. Do not expose these tools to untrusted users on a privileged network. |
pi-provider-kiro
pi-provider-kiro connects pi to the Kiro API (AWS CodeWhisperer/Q) and exposes a set of kiro-cli-verified models through a single provider. It reuses the credentials of an existing kiro-cli session when available and filters the model catalog by your region.
For installation and configuration, please see hascode.com: Kiro Snippets - PI Agent and Kiro.