There are several ways to aggregate and report application performance indicators in a Java application. One common way here is to use Java Management Extensions (JMX) and MBeans.
The Yammer Metrics Library eases this task for us and simplifies the aggregation of different reports.
In the following tutorial, we’re going to set up a full Java EE 7 web application by the help of Maven archetypes and we’re running the application on WildFly application server that is downloaded and configured completely by the WildFly Maven Plugin.
Finally our application is going to use the Java API for JSON Processing to parse lists of public repositories from the GitHub REST API to aggregate different reports, exported via JMX so that we’re finally able to view these reports with jconsole or jmeter.

Project Setup / Dependencies
As in other tutorials, I’m using the Maven archetype org.codehaus.mojo.archetypes:webapp-javaee7 here. You may create an empty project using your IDE of choice or via console:
mvn archetype:generate -Dfilter=webapp-javaee7
[INFO] Scanning for projects...
[INFO]
[INFO] ------------------------------------------------------------------------
[INFO] Building Maven Stub Project (No POM) 1
[INFO] ------------------------------------------------------------------------
[..]
Choose archetype:
1: remote -> org.codehaus.mojo.archetypes:webapp-javaee7 (Archetype for a web application using Java EE 7.)
Choose a number or apply filter (format: [groupId:]artifactId, case sensitive contains): : 1
Also we’re adding the dependency for the metrics-library and for the wildfly-maven-plugin to our pom.xml:
<dependencies>
	[..]
	<dependency>
		<groupId>com.yammer.metrics</groupId>
		<artifactId>metrics-core</artifactId>
		<version>2.2.0</version>
	</dependency>
</dependencies>

<build>
	[..]
	<plugins>
		<plugin>
			<groupId>org.wildfly.plugins</groupId>
			<artifactId>wildfly-maven-plugin</artifactId>
			<version>1.0.2.Final</version>
		</plugin>
	</plugin>
</build>
Adding Work: Parsing public GitHub Repositories
We’d like to collect some metrics from our application while doing some “real work”.
That’s why we’re having a look at the GitHub.com REST browser and we’re implementing some code that pulls a list of all my public repositories, parses it using JSR-353 (Java API for JSON Processing) and prints out some information.
The REST browser allows us to explore the API and to view the JSON structure from the services response:
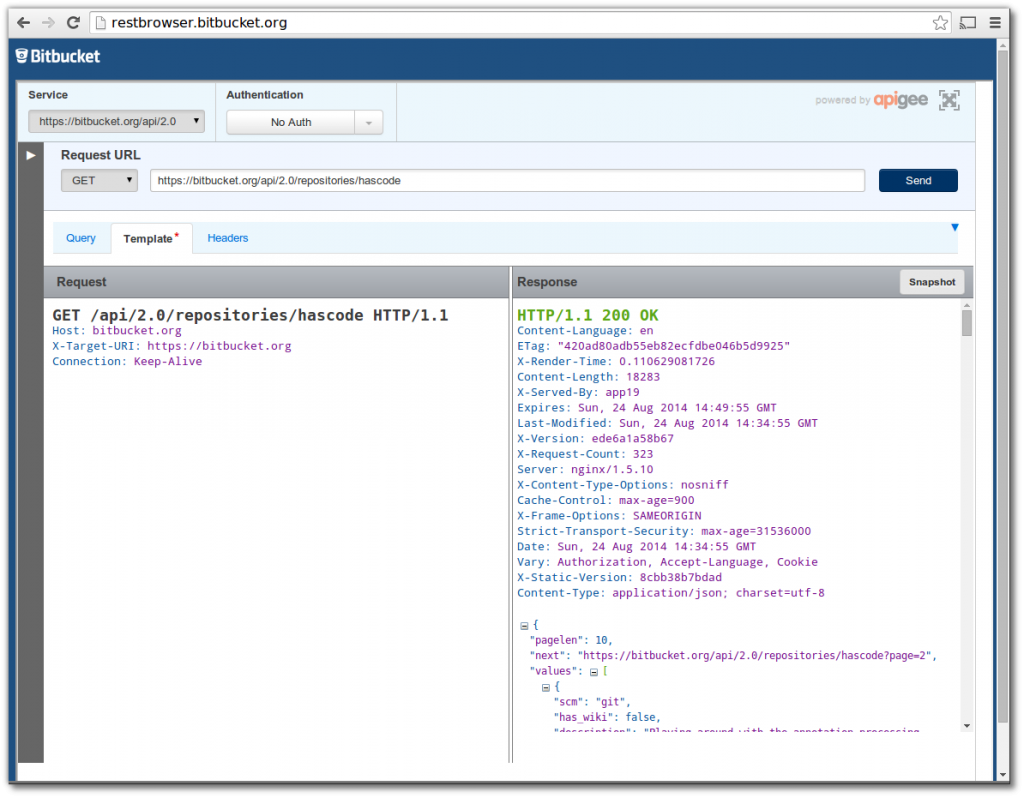
As we can see, we’re getting 10 repositories per page and the link to the next page is contained in the JSON structure. This allows us to recursively process each page-set until the next-page link is null.
private static final String REST_REPOSITORIES_URL = "https://bitbucket.org/api/2.0/repositories/hascode";

URL url = new URL(REST_REPOSITORIES_URL);
queryBitbucket(url);

private void queryBitbucket(final URL url) {
	try (InputStream is = url.openStream(); JsonReader rdr = Json.createReader(is)) {
		JsonObject obj = rdr.readObject();
		JsonNumber currentElements = obj.getJsonNumber("pagelen");
		JsonString nextPage = obj.getJsonString("next");
		log.info("{} elements on current page, next page is: {}", currentElements, nextPage);
		JsonArray repositories = obj.getJsonArray("values");
		for (JsonObject repository : repositories.getValuesAs(JsonObject.class)) {
			log.info("repository '{}' has url: '{}'", repository.getString("name"), repository.getJsonObject("links").getJsonObject("self").getString("href"));
		}
		if (nextPage != null) {
			queryBitbucket(new URL(nextPage.getString()));
		}
	} catch (IOException e) {
		log.warn("io exception thrown", e);
	}
}
Yammer Metrics Library
The project describes itself as
“Metrics is a Java library which gives you unparalleled insight into what your code does in production. Metrics provides a powerful toolkit of ways to measure the behavior of critical components in your production environment. With modules for common libraries like Jetty, Logback, Log4j, Apache HttpClient, Ehcache, JDBI, Jersey and reporting backends like Ganglia and Graphite, Metrics provides you with full-stack visibility.”
For more detailed information, please feel free to have a look at the project website.
Available Components
We have a variety of components to help us measuring performance indicators of our application:
-
Gauges: A gauge allows an instant measurement of a value.
-
Counters: A counter is is a gauge for an AtomicLong instance and adds convenience methods to increment or decrement its value.
-
Meters: A meter is used to measure the rate of events over time.
-
Histograms: A histogram allows us to measure the statistical distribution of values in a stream of data.
-
Timers: A timer allows us to measure the rate that a piece of code is called and the distribution of its duration.
-
Health Checks: Allows us to centralice our health checks and add custom, specialized health checks by registering a subclass of HealthCheck
Reporters
In addition we may select multiple reporters to add our metrics information to log-files, push it using JMX or write it to specialized formats:
-
JMX, using JMXReporter
-
STDOUT, using ConsoleReporter
-
CSV files, using CsvReporter
-
SLF4J loggers, using Slf4jReporter
-
Ganglia, using GangliaReporter
-
Graphite, using GraphiteReporter
Adding Metrics
The following code shows our complete application. For the purpose of this tutorial we’d like to track the following three performance indicators and make them available using JMX:
-
The time needed to process a chunk of repositories pulled from the GitHub REST API, we’re using a timer component here.
-
The amount of repositories parsed. We’re using a counter component here and every time we’re fetching the list of repositories, the counter is reset.
-
The amount of requests send to GitHub. We could have used a counter here but to demonstrate another component, we’re using a gauge here.
We’re using Java EE’s timer service to schedule the execution of the singleton EJB’s parseGitHubRepository method every 30 seconds.
The MetricsRegistry is the part where listeners, reporters etc. are registered and put together.
package com.hascode.tutorial.ejb;

import java.io.IOException;
import java.io.InputStream;
import java.net.MalformedURLException;
import java.net.URL;
import java.util.concurrent.atomic.AtomicLong;

import javax.annotation.PostConstruct;
import javax.annotation.PreDestroy;
import javax.ejb.Schedule;
import javax.ejb.Singleton;
import javax.ejb.Startup;
import javax.json.Json;
import javax.json.JsonArray;
import javax.json.JsonNumber;
import javax.json.JsonObject;
import javax.json.JsonReader;
import javax.json.JsonString;

import org.slf4j.Logger;
import org.slf4j.LoggerFactory;

import com.yammer.metrics.core.Counter;
import com.yammer.metrics.core.Gauge;
import com.yammer.metrics.core.MetricName;
import com.yammer.metrics.core.MetricsRegistry;
import com.yammer.metrics.core.Timer;
import com.yammer.metrics.core.TimerContext;
import com.yammer.metrics.reporting.JmxReporter;

@Singleton
public class ExampleMetricsBean {
	private static final String REST_REPOSITORIES_URL = "https://bitbucket.org/api/2.0/repositories/hascode";

	private final Logger log = LoggerFactory.getLogger(ExampleMetricsBean.class);

	private MetricsRegistry registry;
	private Counter repositoriesParsed;
	private AtomicLong reqSent;
	private JmxReporter reporter;
	private Timer pageProcTimer;

	@PostConstruct
	protected void onBeanConstruction() {
		reqSent = new AtomicLong(0);
		registry = new MetricsRegistry();
		repositoriesParsed = registry.newCounter(ExampleMetricsBean.class, "Repositories-Parsed");
		pageProcTimer = registry.newTimer(ExampleMetricsBean.class, "Processing-Page-Time");
		registry.newGauge(new MetricName(ExampleMetricsBean.class, "Requests-Send-Total"), new Gauge<AtomicLong>() {
			@Override
			public AtomicLong value() {
				return reqSent;
			}
		});
		reporter = new JmxReporter(registry);
		reporter.start();
	}

	@PreDestroy
	protected void onBeanDestruction() {
		reporter.shutdown();
		registry.shutdown();
	}

	@Schedule(second = "*/30", minute = "*", hour = "*")
	public void parseBitbucketRepositories() throws MalformedURLException {
		log.info("parsing bitbucket repositories");
		URL url = new URL(REST_REPOSITORIES_URL);
		repositoriesParsed.clear();
		queryBitbucket(url);
	}

	private void queryBitbucket(final URL url) {
		try (InputStream is = url.openStream(); JsonReader rdr = Json.createReader(is)) {
			TimerContext timerCtx = pageProcTimer.time();
			reqSent.incrementAndGet();
			JsonObject obj = rdr.readObject();
			JsonNumber currentElements = obj.getJsonNumber("pagelen");
			JsonString nextPage = obj.getJsonString("next");
			log.info("{} elements on current page, next page is: {}", currentElements, nextPage);
			JsonArray repositories = obj.getJsonArray("values");
			for (JsonObject repository : repositories.getValuesAs(JsonObject.class)) {
				repositoriesParsed.inc();
				log.info("repository '{}' has url: '{}'", repository.getString("name"), repository.getJsonObject("links").getJsonObject("self").getString("href"));
			}
			timerCtx.stop();
			if (nextPage != null) {
				queryBitbucket(new URL(nextPage.getString()));
			}
		} catch (IOException e) {
			log.warn("io exception thrown", e);
		}
	}
}
Using the Maven WildFly Plugin to run the Application
Now we’re ready to run our application. the WildFly plugin for Maven does the work for us here so that we simply need to run the following command to download, bootstrap and initialize a full blown WildFly application server instance:
mvn clean package wildfly:runAfter some initial output, we should now see a similar output, printing a list of repositories:
8:24:26,189 INFO  [org.jboss.as.server] (management-handler-thread - 4) JBAS018559: Deployed "metrics-jmx-reporting-1.0.0.war" (runtime-name : "metrics-jmx-reporting-1.0.0.war")
18:24:30,055 INFO  [com.hascode.tutorial.ejb.ExampleMetricsBean] (EJB default - 1) parsing bitbucket repositories
18:24:31,000 INFO  [com.hascode.tutorial.ejb.ExampleMetricsBean] (EJB default - 1) 10 elements on current page, next page is: "https://bitbucket.org/api/2.0/repositories/hascode?page=2"
18:24:31,000 INFO  [com.hascode.tutorial.ejb.ExampleMetricsBean] (EJB default - 1) repository 'custom-annotation-processing' has url: 'https://bitbucket.org/api/2.0/repositories/hascode/custom-annotation-processing'
18:24:31,000 INFO  [com.hascode.tutorial.ejb.ExampleMetricsBean] (EJB default - 1) repository 'javaee7-wildfly-liquibase-migrations' has url: 'https://bitbucket.org/api/2.0/repositories/hascode/javaee7-wildfly-liquibase-migrations'
18:24:31,000 INFO  [com.hascode.tutorial.ejb.ExampleMetricsBean] (EJB default - 1) repository 'xmlbeam-tutorial' has url: 'https://bitbucket.org/api/2.0/repositories/hascode/xmlbeam-tutorial'
18:24:31,001 INFO  [com.hascode.tutorial.ejb.ExampleMetricsBean] (EJB default - 1) repository 'rest-test-tutorial' has url: 'https://bitbucket.org/api/2.0/repositories/hascode/rest-test-tutorial'
18:24:31,001 INFO  [com.hascode.tutorial.ejb.ExampleMetricsBean] (EJB default - 1) repository 'functional-java-examples' has url: 'https://bitbucket.org/api/2.0/repositories/hascode/functional-java-examples'
18:24:31,001 INFO  [com.hascode.tutorial.ejb.ExampleMetricsBean] (EJB default - 1) repository 'junit-4.11-examples' has url: 'https://bitbucket.org/api/2.0/repositories/hascode/junit-4.11-examples'
18:24:31,001 INFO  [com.hascode.tutorial.ejb.ExampleMetricsBean] (EJB default - 1) repository 'html5-js-video-manipulation' has url: 'https://bitbucket.org/api/2.0/repositories/hascode/html5-js-video-manipulation'
[..]
18:24:31,569 INFO  [com.hascode.tutorial.ejb.ExampleMetricsBean] (EJB default - 1) 10 elements on current page, next page is: "https://bitbucket.org/api/2.0/repositories/hascode?page=4"
18:24:31,569 INFO  [com.hascode.tutorial.ejb.ExampleMetricsBean] (EJB default - 1) repository 'groovy-maven-plugin' has url: 'https://bitbucket.org/api/2.0/repositories/hascode/groovy-maven-plugin'
18:24:31,569 INFO  [com.hascode.tutorial.ejb.ExampleMetricsBean] (EJB default - 1) repository 'android-fragment-app' has url: 'https://bitbucket.org/api/2.0/repositories/hascode/android-fragment-app'
18:24:31,569 INFO  [com.hascode.tutorial.ejb.ExampleMetricsBean] (EJB default - 1) repository 'story-branches-git-hg-samples' has url: 'https://bitbucket.org/api/2.0/repositories/hascode/story-branches-git-hg-samples'
18:24:31,569 INFO  [com.hascode.tutorial.ejb.ExampleMetricsBean] (EJB default - 1) repository 'jee6-timer-tutorial' has url: 'https://bitbucket.org/api/2.0/repositories/hascode/jee6-timer-tutorial'
18:24:31,569 INFO  [com.hascode.tutorial.ejb.ExampleMetricsBean] (EJB default - 1) repository 'maven-embedded-tomcat-auth-tutorial' has url: 'https://bitbucket.org/api/2.0/repositories/hascode/maven-embedded-tomcat-auth-tutorial'
18:24:31,569 INFO  [com.hascode.tutorial.ejb.ExampleMetricsBean] (EJB default - 1) repository 'jpa2_tutorial' has url: 'https://bitbucket.org/api/2.0/repositories/hascode/jpa2_tutorial'
18:24:31,570 INFO  [com.hascode.tutorial.ejb.ExampleMetricsBean] (EJB default - 1) repository 'contract-first-webservice-tutorial' has url: 'https://bitbucket.org/api/2.0/repositories/hascode/contract-first-webservice-tutorial'
18:24:31,570 INFO  [com.hascode.tutorial.ejb.ExampleMetricsBean] (EJB default - 1) repository 'hascode-tutorials' has url: 'https://bitbucket.org/api/2.0/repositories/hascode/hascode-tutorials'
18:24:31,570 INFO  [com.hascode.tutorial.ejb.ExampleMetricsBean] (EJB default - 1) repository 'android-theme-tutorial' has url: 'https://bitbucket.org/api/2.0/repositories/hascode/android-theme-tutorial'
18:24:31,570 INFO  [com.hascode.tutorial.ejb.ExampleMetricsBean] (EJB default - 1) repository 'selenium-webdriver-tutorial' has url: 'https://bitbucket.org/api/2.0/repositories/hascode/selenium-webdriver-tutorial'
18:24:31,878 INFO  [com.hascode.tutorial.ejb.ExampleMetricsBean] (EJB default - 1) 10 elements on current page, next page is: "https://bitbucket.org/api/2.0/repositories/hascode?page=5"
[..]
Connecting jconsole
Now that the application is running, we’re ready to attach out tool of choice to the Java process – I’m using jconsole here as it is bundle with the JDK:
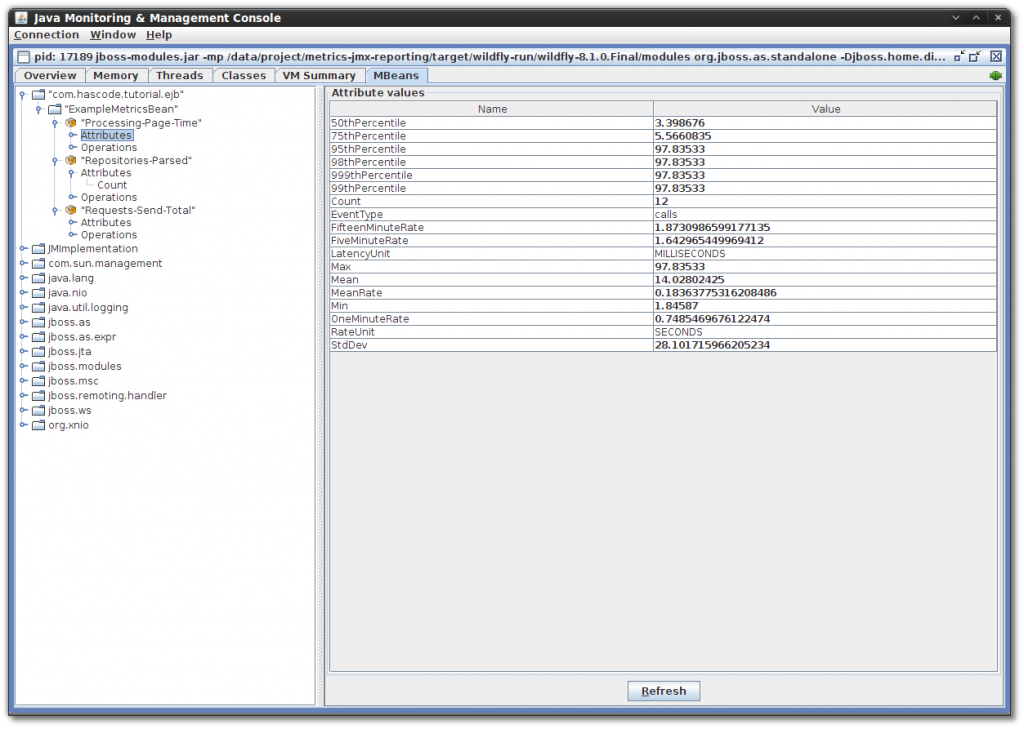
Report: Processing-Page-Time
This is the result from our timer in jconsole

Report: Repositories-Parsed
As we can see, 114 repositories were parsed:

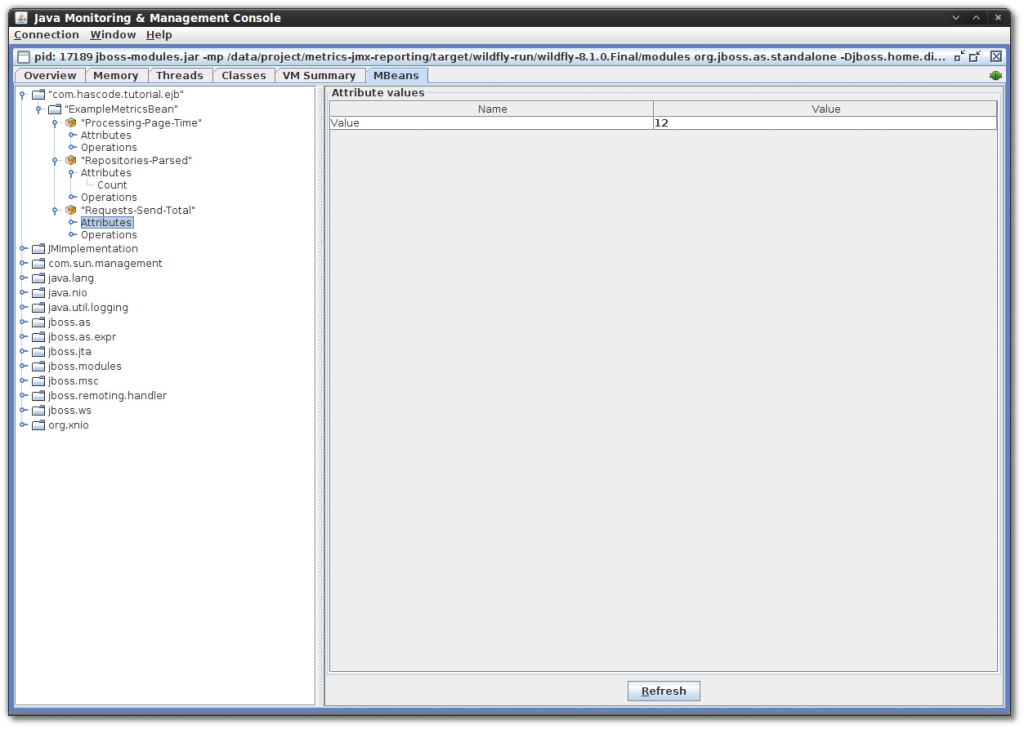
Report: Requests-Send-Total
And finally the proof that we needed 12 requests to fetch all repositories from GitHub:
Another Approach: Using metrics-cdi
Antonin Stefanutti the author of the metrics-cdi library kindly helped me to port the application to a more CDI-friendly approach. The only downside is, that we need a _CDI 1.2 compatible application server now – e.g. using GlassFish 4.1 or a patched WildFly (I have added a short how-to in the appendix).
According to its https://github.com/astefanutti/metrics-cdimetrics-cdi allows us to..
-
Intercept invocations of bean constructors, methods and public methods of bean classes annotated with @Counted, @ExceptionMetered, @Metered and @Timed,
-
Create Gauge and CachedGauge instances for bean methods annotated with @Gauge and @CachedGauge respectively,
-
Inject Counter, Gauge, Histogram, Meter and Timer instances,
-
Register or retrieve the produced Metric instances in the resolved MetricRegistry bean,
-
Declare automatically a default MetricRegistry bean if no one exists in the CDI container.
Dependencies
We need to add only one dependency to our pom.xml. To avoid confusion, we should remove the other metrics-dependencies from the application above first.
<dependency>
	<groupId>io.astefanutti.metrics.cdi</groupId>
	<artifactId>metrics-cdi</artifactId>
	<version>1.0.0</version>
</dependency>
CDI Bean Discovery
We need to add the following beans.xml to our WEB-INF directory:
<?xml version="1.0" encoding="UTF-8"?>
<beans xmlns="http://xmlns.jcp.org/xml/ns/javaee" xmlns:xsi="http://www.w3.org/2001/XMLSchema-instance"
	xsi:schemaLocation="http://xmlns.jcp.org/xml/ns/javaee http://xmlns.jcp.org/xml/ns/javaee/beans_1_1.xsd"
	version="1.1" bean-discovery-mode="all">
</beans>
Metrics Registry Configuration
We’re using a CDI producer here to setup our metrics registry and start the JMX reporter.
package com.hascode.tutorial.ejb;

import javax.enterprise.context.ApplicationScoped;
import javax.enterprise.inject.Produces;

import com.codahale.metrics.JmxReporter;
import com.codahale.metrics.MetricRegistry;

public class MetricRegistryFactoryBean {
	@Produces
	@ApplicationScoped
	private MetricRegistry metricRegistry() {
		MetricRegistry registry = new MetricRegistry();
		JmxReporter reporter = JmxReporter.forRegistry(registry).build();
		reporter.start();
		return registry;
	}

	// shutdown reporter ...
}
Reworked ExampleMetricsBean
This is our reworked metrics bean. We have moved some of the work to another bean that is injected here:
package com.hascode.tutorial.ejb;

@Singleton
@LocalBean
public class ExampleMetricsBean {
	[..]

	@Inject
	RepositoryProcessor repositoryProcessor;

	@Schedule(second = "*", minute = "*/1", hour = "*")
	public void parseBitbucketRepositories() throws MalformedURLException {
		[..]
		queryBitbucket(url);
	}

	private void queryBitbucket(final URL url) {
		[..]
		queryBitbucket(new URL(nextPage.getString()));
		[..]
	}
}
The Fun Part: Repository Processor using Metrics Annotations
Now we’re adding the part where the metrics are created. Thanks to metrics-cdi we’re able to create timer benchmarks by adding an @Timed annotation to a method or to inject a counter instance.
package com.hascode.tutorial.ejb;

[..]

import com.codahale.metrics.Counter;
import com.codahale.metrics.annotation.Metric;
import com.codahale.metrics.annotation.Timed;

public class RepositoryProcessor {
	[..]

	@Inject
	@Metric(name = "Repositories-Parsed")
	private Counter repositoriesParsed;

	@Timed(name = "Processing-Page-Time")
	public JsonString handleJson(final JsonReader rdr) {
		[..]
		for (JsonObject repository : repositories.getValuesAs(JsonObject.class)) {
			repositoriesParsed.inc();
			[..]
		}
		return nextPage;
	}
}
Appendix A: Patching WildFly for CDI 1.2/Weld 2.2
Patching the WildFly is really easy and done quick using the following steps:
-
Download the adequate patch file from http://sourceforge.net/projects/jboss/files/Weld/2.2.2.Final/
-
Assure WildFly is running and use the jboss-cli tool to apply the patch:
$ sh jboss-cli.sh
You are disconnected at the moment. Type 'connect' to connect to the server or 'help' for the list of supported commands.
[disconnected /] connect
[standalone@localhost:9990 /] patch apply ~/Downloads/wildfly-8.1.0.Final
wildfly-8.1.0.Final-weld-2.2.2.Final-patch.zip  wildfly-8.1.0.Final.tar.gz
[standalone@localhost:9990 /] patch apply ~/Downloads/wildfly-8.1.0.Final-weld-2.2.2.Final-patch.zip
{
    "outcome" : "success",
    "response-headers" : {
        "operation-requires-restart" : true,
        "process-state" : "restart-required"
    }
}
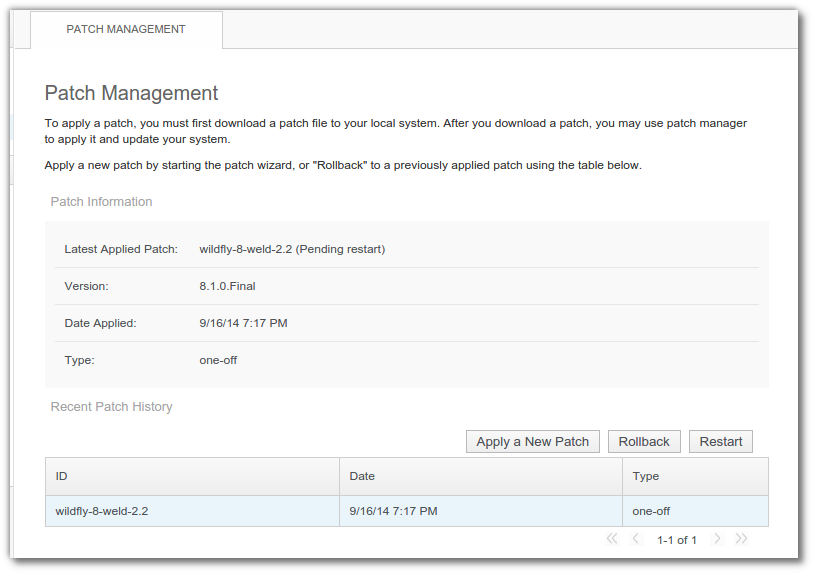
In addition to the patch result from the cli tool, we’re also able to verify that the patch has been applied by taking a look at the web admin console:
Tutorial Sources
Please feel free to download the tutorial sources from my GitHub repository, fork it there or clone it using Git:
git clone https://bitbucket.org/hascode/javaee7-metrics-jmx.gitResources
Article Updates
-
2014-09-25: Added a solution using the metrics-cdi library (thanks to Antonin Stefanutti for help and input here)
