Articles Tagged ‘jvm’

Analyzing Java Applications on the Fly with Arthas

Wednesday, October 31st, 2018

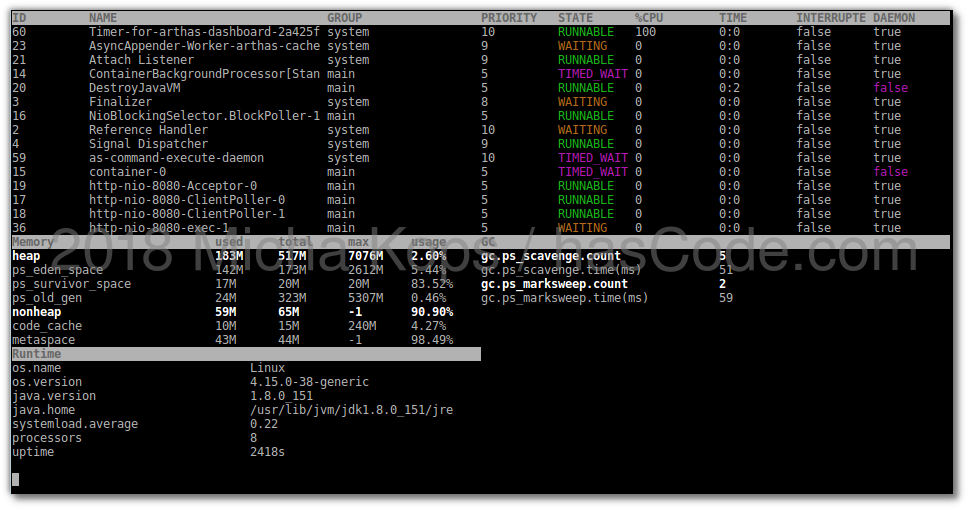
Arthas created by Alibaba is a tool that allows developers to connect to running Java applications without stopping them or suspending threads for debugging the application from the console.

It offers features like monitoring invocation statistics, searching for classes and methods in the classloaders, view method invocation details (like parameters), show the stack trace of a method invocation, monitor system metrics and others.

In the following examples I’m going to demonstrate some of these features applied to a running web application.

(more…)

Analyzing Java Problems – Tools, Snippets and Workflows

Monday, April 30th, 2018

When we need to investigate the cause for a dysfunctional Java application we have a plethora of tools available that on the one hand help us in gathering information, artifacts and statistics and on the other hand help us in processing this information and identifying possible problems.

The following list of tools, snippets, workflows and information about specific artifacts could provide a starting point for analyzing such problems and covers topics like heap-dumps, thread-dumps, heap-histograms, heap-regions, garbage-collection-logs, hotspot-compiler/codecache-logs, debugging native-memory, tools for heap-dump-analysis, JVM unified logging and more..

(more…)

Snippet: Java Mission Control (JMC) and Flight Recorder (JFR)

Wednesday, October 11th, 2017

The Java Mission Control and the Java Flight Recorder allow us to capture run-time information from our Java applications without much overhead and aggregate profiling information.

I have written down the commands that I’m using the most when profiling a Java application with this tool chain in the following article.

(more…)

Microbenchmarks with JMH / Java Microbenchmark Harness

Monday, October 2nd, 2017

Writing microbenchmarks for parts of our applications is not always easy – especially when the internals of the virtual machine, the just-in-time-compiler and such things are coming into effect.

Java Microbenchmark Harness is a tool that takes care of creating JVM warmup-cycles, handling benchmark-input-parameters and running benchmarks as isolated processes etc.

Now following a few short examples for writing microbenchmarks with JMH.
(more…)

Finding Memory Leaks using Eclipse and the MemoryAnalyzer Plugin

Wednesday, November 2nd, 2011

The MemoryAnalyzer Plugin for Eclipse allows us to quickly analyze heap dumps from a virtual machine and search for memory leaks. In the following tutorial we’re going to create and run a small application that is going to cause an OutOfMemoryException during its runtime.

In addition, we’re forcing the virtual machine to save a heap dump and finally analyzing this data using Eclipse and the MemoryAnalyzer plugin.

(more…)

Search
Tags
Categories