Capacity Planning using the Universal Scalability Law with Java and usl4j
September 30th, 2018 by Micha KopsCapacity planning is an important task when trying to anticipate resources and scaling factors for our applications.
The usl4j library offers us an easy abstraction for Neil J. Gunther’s Universal Scalability Law and allows us to build up a predictive model based on the parameters throughput, latency and concurrent operations.
With a basic input set of two of these parameters, we are able to predict how these values change if we change one input parameter so that we can build our infrastructure or systems according to our SLAs.
Contents
Setup
Using Maven we need to add just one dependency to our project’s pom.xml:
<dependency>
  <groupId>com.codahale</groupId>
  <artifactId>usl4j</artifactId>
  <version>0.7.0</version>
</dependency>
Creating the Model and Building Predictions
We’re using usl4j to build a model based on concurrency and throughput (we need to pick two of the three possible parameters concurrency, throughput and latency).
The input values are based on a quick measurement of a Spring Boot demo application (see my article: “Integrating Swagger into a Spring Boot RESTful Webservice with Springfox“) taken with the Apache Bench tool (see Appendix A: Apache Bench (ab)).
With this model, we’re calculating predictions 10, 50, 100, 500, 1000, 50000 and 100000 concurrent workers and we print them to the screen.
package com.hascode.tutorial;

import com.codahale.usl4j.Measurement;
import com.codahale.usl4j.Model;
import java.util.Arrays;
import java.util.function.Consumer;

public class SampleUSLCalculation {

  public static void main(String[] args) {
    // measured with ab (apache benchmark) from a spring boot demo app (devmode)
    final double[][] input = {{1, 412.53}, {2, 1355.32}, {3, 2207.16}, {4, 2466.22}, {5, 2549.40},
        {6, 2679.73}};

    final Model model = Arrays.stream(input)
        .map(Measurement.ofConcurrency()::andThroughput)
        .collect(Model.toModel());

    Consumer<Integer> stats = (workers) -> System.out
        .printf("At %-8d workers, expect %5.4f req/sec%n", workers,
            model.throughputAtConcurrency(workers));

    stats.accept(10);
    stats.accept(50);
    stats.accept(100);
    stats.accept(500);
    stats.accept(1_000);
    stats.accept(50_000);
    stats.accept(100_000);
  }
}
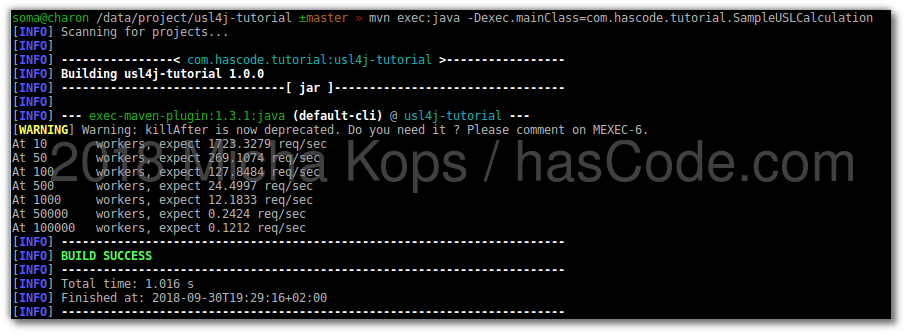
Running the code above e.g. in the console should produce a similar output to this one:
$ mvn exec:java -Dexec.mainClass=com.hascode.tutorial.SampleUSLCalculation
[..]
At 10       workers, expect 1723.3279 req/sec
At 50       workers, expect 269.1074 req/sec
At 100      workers, expect 127.8484 req/sec
At 500      workers, expect 24.4997 req/sec
At 1000     workers, expect 12.1833 req/sec
At 50000    workers, expect 0.2424 req/sec
At 100000   workers, expect 0.1212 req/sec
[INFO] ------------------------------------------------------------------------
[INFO] BUILD SUCCESS
[INFO] ------------------------------------------------------------------------
[INFO] Total time: 1.016 s
[INFO] Finished at: 2018-09-30T19:29:16+02:00
[INFO] ------------------------------------------------------------------------
Animated ;)
Tutorial Sources
Please feel free to download the tutorial sources from my Bitbucket repository, fork it there or clone it using Git:
git clone https://bitbucket.org/hascode/usl4j-tutorial.git
Resources
Appendix A: Apache Bench (ab)
For more detailed information about using ab, please consult its man-page: http://httpd.apache.org/docs/2.4/programs/ab.html
ab -c 1 -n 1000000 -t 60 http://localhost:8080/currentdate/yyyy-MM

Concurrency Level:      1
Time taken for tests:   23.554 seconds
Complete requests:      50000
Failed requests:        0
Total transferred:      9950000 bytes
HTML transferred:       2550000 bytes
Requests per second:    2122.75 [#/sec] (mean)
Time per request:       0.471 [ms] (mean)
Time per request:       0.471 [ms] (mean, across all concurrent requests)
Transfer rate:          412.53 [Kbytes/sec] received

ab -c 2 -n 1000000 -t 60 http://localhost:8080/currentdate/yyyy-MM

Concurrency Level:      2
Time taken for tests:   7.169 seconds
Complete requests:      50000
Failed requests:        0
Total transferred:      9950000 bytes
HTML transferred:       2550000 bytes
Requests per second:    6974.09 [#/sec] (mean)
Time per request:       0.287 [ms] (mean)
Time per request:       0.143 [ms] (mean, across all concurrent requests)
Transfer rate:          1355.32 [Kbytes/sec] received

ab -c 3 -n 1000000 -t 60 http://localhost:8080/currentdate/yyyy-MM

Concurrency Level:      3
Time taken for tests:   4.402 seconds
Complete requests:      50000
Failed requests:        0
Total transferred:      9950000 bytes
HTML transferred:       2550000 bytes
Requests per second:    11357.44 [#/sec] (mean)
Time per request:       0.264 [ms] (mean)
Time per request:       0.088 [ms] (mean, across all concurrent requests)
Transfer rate:          2207.16 [Kbytes/sec] received

ab -c 4 -n 1000000 -t 60 http://localhost:8080/currentdate/yyyy-MM

Concurrency Level:      4
Time taken for tests:   3.940 seconds
Complete requests:      50000
Failed requests:        0
Total transferred:      9950000 bytes
HTML transferred:       2550000 bytes
Requests per second:    12690.49 [#/sec] (mean)
Time per request:       0.315 [ms] (mean)
Time per request:       0.079 [ms] (mean, across all concurrent requests)
Transfer rate:          2466.22 [Kbytes/sec] received

ab -c 5 -n 1000000 -t 60 http://localhost:8080/currentdate/yyyy-MM

Concurrency Level:      5
Time taken for tests:   3.811 seconds
Complete requests:      50000
Failed requests:        0
Total transferred:      9950000 bytes
HTML transferred:       2550000 bytes
Requests per second:    13118.51 [#/sec] (mean)
Time per request:       0.381 [ms] (mean)
Time per request:       0.076 [ms] (mean, across all concurrent requests)
Transfer rate:          2549.40 [Kbytes/sec] received

ab -c 6 -n 1000000 -t 60 http://localhost:8080/currentdate/yyyy-MM

Concurrency Level:      6
Time taken for tests:   3.626 seconds
Complete requests:      50000
Failed requests:        0
Total transferred:      9950000 bytes
HTML transferred:       2550000 bytes
Requests per second:    13789.17 [#/sec] (mean)
Time per request:       0.435 [ms] (mean)
Time per request:       0.073 [ms] (mean, across all concurrent requests)
Transfer rate:          2679.73 [Kbytes/sec] received
Appendix B: wrk Benchmark Tool
For more detailed information about its usage, please consult the corresponding GitHub page: https://github.com/wg/wrk
Update: There’s now wrk2 that seems to be more precise.
wrk -d 1m -t 1 http://localhost:8080/currentdate/yyyy-MM                                                          1 ↵
Running 1m test @ http://localhost:8080/currentdate/yyyy-MM
  1 threads and 10 connections
  Thread Stats   Avg      Stdev     Max   +/- Stdev
    Latency   621.20us    0.88ms  28.49ms   93.63%
    Req/Sec    20.88k     4.47k   26.87k    85.83%
  1246239 requests in 1.00m, 259.45MB read
Requests/sec:  20770.26
Transfer/sec:      4.32MB

wrk -d 1m -t 2 http://localhost:8080/currentdate/yyyy-MM
Running 1m test @ http://localhost:8080/currentdate/yyyy-MM
  2 threads and 10 connections
  Thread Stats   Avg      Stdev     Max   +/- Stdev
    Latency   658.82us  828.31us  15.59ms   92.42%
    Req/Sec     9.96k   842.39    12.14k    71.58%
  1189582 requests in 1.00m, 248.67MB read
Requests/sec:  19820.91
Transfer/sec:      4.14MB

wrk -d 1m -t 3 http://localhost:8080/currentdate/yyyy-MM
Running 1m test @ http://localhost:8080/currentdate/yyyy-MM
  3 threads and 10 connections
  Thread Stats   Avg      Stdev     Max   +/- Stdev
    Latency   662.69us    0.92ms  19.63ms   92.20%
    Req/Sec     6.22k   827.86     8.28k    70.56%
  1114545 requests in 1.00m, 232.98MB read
Requests/sec:  18561.74
Transfer/sec:      3.88MB

wrk -d 1m -t 4 http://localhost:8080/currentdate/yyyy-MM
Running 1m test @ http://localhost:8080/currentdate/yyyy-MM
  4 threads and 10 connections
  Thread Stats   Avg      Stdev     Max   +/- Stdev
    Latency   754.31us    1.00ms  20.00ms   92.17%
    Req/Sec     3.47k     0.97k    6.18k    62.98%
  829340 requests in 1.00m, 173.36MB read
Requests/sec:  13817.65
Transfer/sec:      2.89MB

wrk -d 1m -t 5 http://localhost:8080/currentdate/yyyy-MM
Running 1m test @ http://localhost:8080/currentdate/yyyy-MM
  5 threads and 10 connections
  Thread Stats   Avg      Stdev     Max   +/- Stdev
    Latency     1.07ms    1.42ms  24.05ms   89.94%
    Req/Sec     2.76k   798.62     5.34k    66.50%
  824038 requests in 1.00m, 172.25MB read
Requests/sec:  13718.01
Transfer/sec:      2.87MB

wrk -d 1m -t 6 http://localhost:8080/currentdate/yyyy-MM
Running 1m test @ http://localhost:8080/currentdate/yyyy-MM
  6 threads and 10 connections
  Thread Stats   Avg      Stdev     Max   +/- Stdev
    Latency   526.90us    0.87ms  36.32ms   95.35%
    Req/Sec     2.38k   443.07     3.46k    65.86%
  853914 requests in 1.00m, 178.50MB read
Requests/sec:  14211.87
Transfer/sec:      2.97MB
Tags: ab, Apache, bandwidth, benchmark, calculate, capacity, latency, little, measure, planning, predict, prediction, throughput, universal scalability law, usl4j, wrk, wrk2

